Overview
The Telegraf Collector operates as a WebSocket server that accepts connections from Telegraf agents configured with the WebSocket output plugin. It parses incoming InfluxDB Line Protocol (ILP) messages, creates historian tags based on measurements and fields, and buffers the data for storage in Timebase Historian.
Reference the article General Configuration of the Data Collector to learn how to target a historian and dataset and apply security. This article focuses on the specific configuration of the Telegraf data type.
Telegraf Connection
Connection
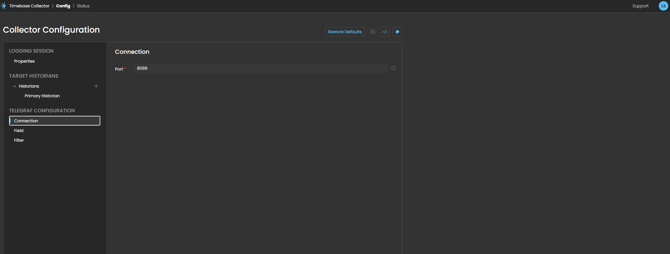
Port: The TCP port number on which the WebSocket server listens for incoming Telegraf connections. The standard InfluxDB port is 8086, making it easy to transition from InfluxDB to Timebase Historian without reconfiguring your Telegraf agents.
Diving Deeper
The collector will expose a WebSocket endpoint at ws://[hostname]:8086 where Telegraf agents can connect.
To verify the server is running, you can navigate to https://[hostname]:8086/status in your web browser, which will display connection information.
FIELD
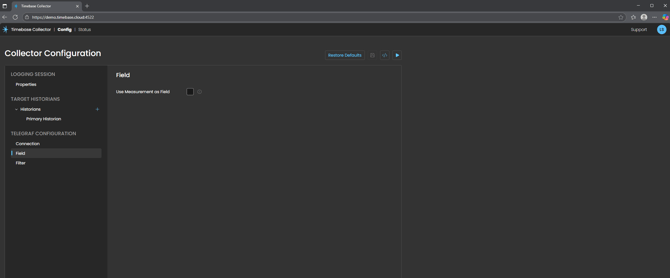
Use Measurement as Field: When enabled, this option adds the InfluxDB measurement name as a field on the created historian tags. This can be useful for organizing and filtering tags when multiple measurements are being collected.
Diving Deeper
Lets look at the behaviour of this setting. When true, each tag will include a Measurement field containing the measurement name from the InfluxDB Line Protocol. When false, only the tags defined in the InfluxDB Line Protocol will be included as fields
Example:
Given an InfluxDB Line Protocol message: cpu,host=server01,region=us-west usage_idle=85.51672531200000000000 with Use Measurement as Field set to FALSE, the resulting tag fields would be:
host: server01
region: us-west
With Use Measurement as Field set to TRUE, the resulting tag fields would be:
host: server01
region: us-west
Measurement: cpu
FILTER
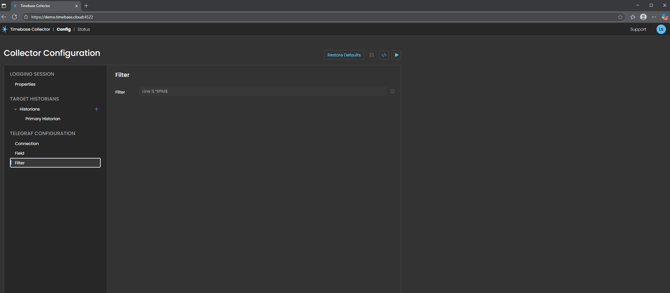
Filter: A .NET regular expression (regex) used to exclude metrics from logging; the collector evaluates the regex against each tag name and excludes any tag that matches the pattern, allowing broad subscriptions while preventing unwanted tags from being written to the historian.
How .NET Regex Filtering Works
The .NET regex engine matches your pattern against the full metric name provided in each message; if the name matches the pattern, the collector does not log that metric, which helps keep the historian focused on meaningful operational data.
Simple Contains Match
To exclude any metric containing the word Debug, simply enter Debug into the filter.
Prefix Based Filtering
To exclude all metrics beginning with a specific device prefix, use: ^Filler02_.* which removes Filler02_Speed, Filler02_Temp, and all other metrics starting with Filler02_.
Excluding Classes of Metrics
If alarm metrics follow a known prefix such as Alarm_, you can exclude them using: ^Alarm_.* which keeps the historian from filling with high-frequency alarm chatter.
Matching Multiple Patterns
To exclude metrics belonging to either of two prefixes, use: ^(Filler02_|Capper01_).* which uses .NET grouping and alternation.
Using Negative Lookahead
To keep all metrics except those containing the word Test, use: ^(?!.*Test).* which is a .NET negative lookahead pattern and excludes any name containing Test while allowing everything else.
For a online tutorial in regex or to learn more, we recommend the website RegExr - https://regexr.com/
Telegraf Configuration
The settings above complete the configuration of the Timebase Telegraf Collector itself. The collector is now ready to accept incoming WebSocket connections and log data to the target historian. What follows in this next section is not configuration of the Collector, but configuration of Telegraf.
Telegraf is the external agent that publishes metrics. It must be pointed at the Collector’s WebSocket endpoint so that the data you are collecting is actually transmitted to Timebase.
To send data to the Timebase Telegraf Collector, configure the Telegraf WebSocket output plugin:
[[outputs.websocket]]
  ## WebSocket endpoint URL
  url = "ws://localhost:8086"

  ## Data format (must be influx for Line Protocol)
  data_format = "influx"

  ## Optional: Connection settings
  # connect_timeout = "30s"
  # write_timeout = "10s"
Diving Deeper
Supported Data Types: The collector automatically detects and maps InfluxDB field types to Timebase Historian data types:
| InfluxDB Type | Detection | Historian Type | Example |
|---|---|---|---|
| String | Quoted values | System.String | "normal" |
| Integer | Ends with i |
System.Int32 | 42i |
| Float | Decimal number | System.Double | 72.5 |
| Boolean | true, false, t, f |
System.Boolean | true |
Message Transport: The collector supports multiple message transport formats over WebSockets:
Text Messages: Standard UTF-8 encoded InfluxDB Line Protocol messages. Multiple lines can be sent in a single WebSocket message, separated by newlines.
Binary Messages: The collector can handle binary WebSocket messages in three formats:
UTF-8 Encoded: Binary data containing UTF-8 encoded Line Protocol
GZIP Compressed: GZIP-compressed Line Protocol for bandwidth efficiency
Custom Binary Format: Length-prefixed messages (4-byte length header + message data)