
MENU

Atlas connects to your historians, MES, LIMS, CMMS, ERP, and other data systems and applies object-oriented principles and knowledge graphs to the OT world, enabling flexible models that can be used to solve your most complex business problems. With a built-in websocket interface, Atlas itself functions as a Unified Namespace you can subscribe to directly.
Bridge is a pipeline-driven integration engine that extends Atlas by delivering modeled data to systems that cannot subscribe directly.
Join the BetaTimebase data collection builds on top of the industry standards you are already following. All Collectors feature Store and Forward with automatic data buffering and disk storage and can stream to multiple Timebase Historians simultaneously.
Connect directly to OPC UA servers to subscribe to tags and log to the Timebase historian.
Supports continuous sampling, event-driven updates, and data change notifications, ensuring that value changes are captured reliably and without polling overhead.
Allows Timebase to ingest structured, typed, and stateful MQTT data based on the Sparkplug B specification.
It's designed for environments where reliable equipment state, accurate metric reporting, and minimal polling overhead are important.
Connects directly to standard MQTT brokers to ingest high-frequency publish/subscribe data into the Timebase Historian.
Supports raw topic ingestion with flexible payload handling, making it ideal for lightweight devices, and systems that publish MQTT without Sparkplug structure.
Integrates natively with Inductive Automation Ignition 8.3+ to stream tag history directly into Timebase using native Ignition configuration.
Designed for plants standardizing on Ignition, providing a simple, reliable path to long-term storage without additional gateways or polling load.
Allows Timebase to ingest metrics collected by Telegraf from IT, OT, and infrastructure systems and reliably store them.
Supports hundreds of input plugins, enabling unified storage of system, network, and application telemetry alongside operational time-series data.
Provides a fully documented interface to programmatically create and manage datasets, define and update tags, and write time-series data directly into Timebase.
Designed for custom applications and integrations where direct control, versioning, and repeatable data ingestion are required.
Timebase is built by process and control engineers with decades of plant-floor experience and a deep respect for the people asked to do more with less. Every design choice reflects that reality, delivering the tools engineers actually need to do the job right.
The Timebase Historian archive is tested continuously with more than 1,000,000 tags, sustaining not just large tag counts but high write speeds.
Never be forced to make a decision about whether you can historize a tag again. Store what you want to store without worrying about tag licensing limits holding you back.
If you need high resolution time series data performance, you can't use SQL. That's why we engineered our historian to use a file-based structure optimized for read and write.
A Timebase Dataset is capable of 150,000 updates, or writes, per second. With speeds like that you can capture every point that matters without limitations.
Every data point you store is a data point you keep. We use a purpose-built algorithm to ensure optimal storage without sacrificing data fidelity.
Estimate your storage needs
It's crucial that Operations can own and manage a historian. Timebase makes it easy for you to do just that. No database skills or advanced IT knowledge required.
All Timebase components can run in a Windows environment or on Linux as docker containers. Rest assured, you will get the same great performance no matter your OS.
Run as many Timebase instances as you need. Data loggers will point to multiple servers ensuring independent data streams are writing values 24/7 to all your historians.
.data files, while string and object values are stored in separate .object files. If a dataset exceeds 20,000 tags, the hourly block is automatically split across multiple files to maintain performance. This segmented structure means that any time-bound operation, whether a query, an archive, or a deletion of old data, touches only the relevant hourly files rather than a monolithic database, which keeps operations fast and surgical.The tag list, including all tag names, descriptions, data types, units of measure, and metadata Fields, lives separately in a tag.config file. This file is the index that connects tag identities to the values stored in the hourly data files, and it must always be included in any backup or recovery operation alongside the data files themselves. Without it, the historical values cannot be interpreted. The practical benefit of this architecture is that backup, restore, and archiving are straightforward file copy operations with no database tooling required, and individual hourly files can be moved or archived independently without affecting ongoing data collection..data and .object history files along with the tag.config file, which maps tag identities to the stored data. There are no proprietary backup utilities or database export processes required. Files can be copied to any external location, network share, or cloud storage using standard IT procedures. For Docker deployments, Docker Volumes are the recommended approach for persistence and backup. In a recovery scenario, restoring the files restores the complete historical record.Making your data work for you is all about having great trending tools at the ready for your engineers and operators. Explorer trending delivers in a major way. Run batch comparisons, do detailed trend over trend analysis, and quickly convert pens into raw data tables... and yes, you can export them to CSV.
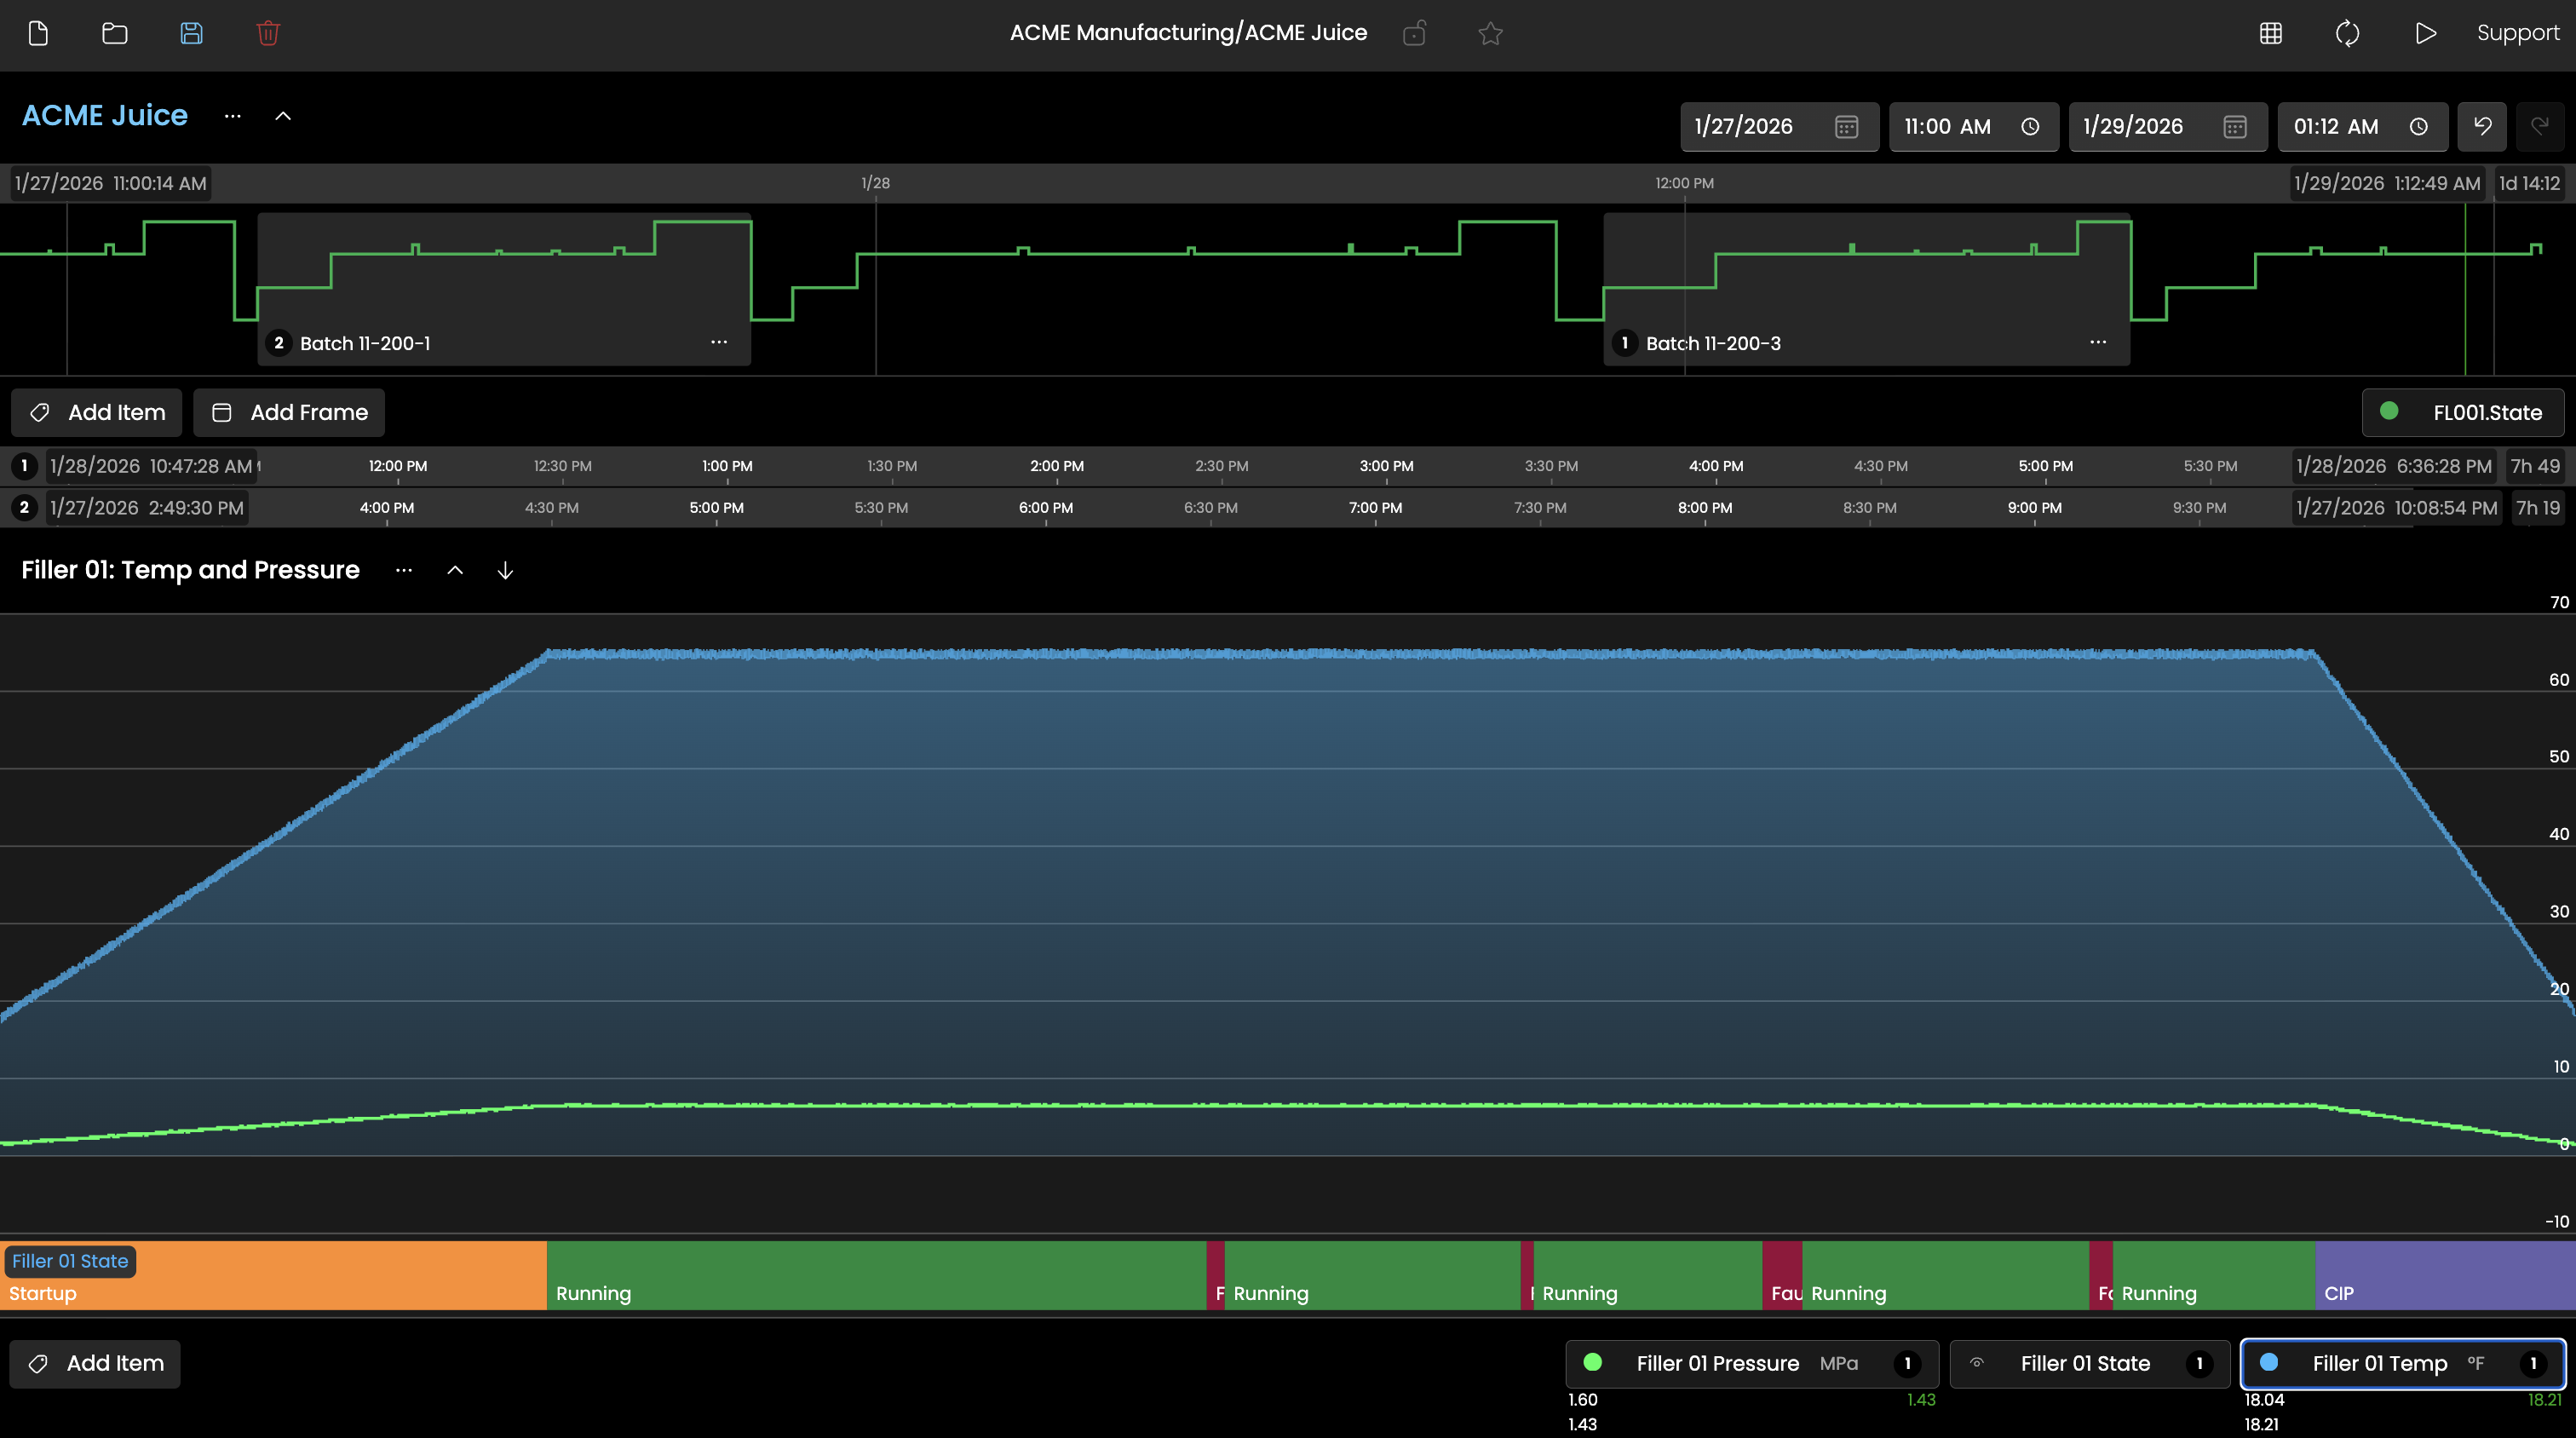
More than just trend lines, Explorer provides unique State visualization and high-level context views of key variables.
Quickly pivot between trends and data tables, with perfect time stamp normalization across various data resolutions.
Overlay multiple batches and compare key data points with perfect alignment.

When you convert various batches or period comparisons to data tables, the timestamps sync to the event start.
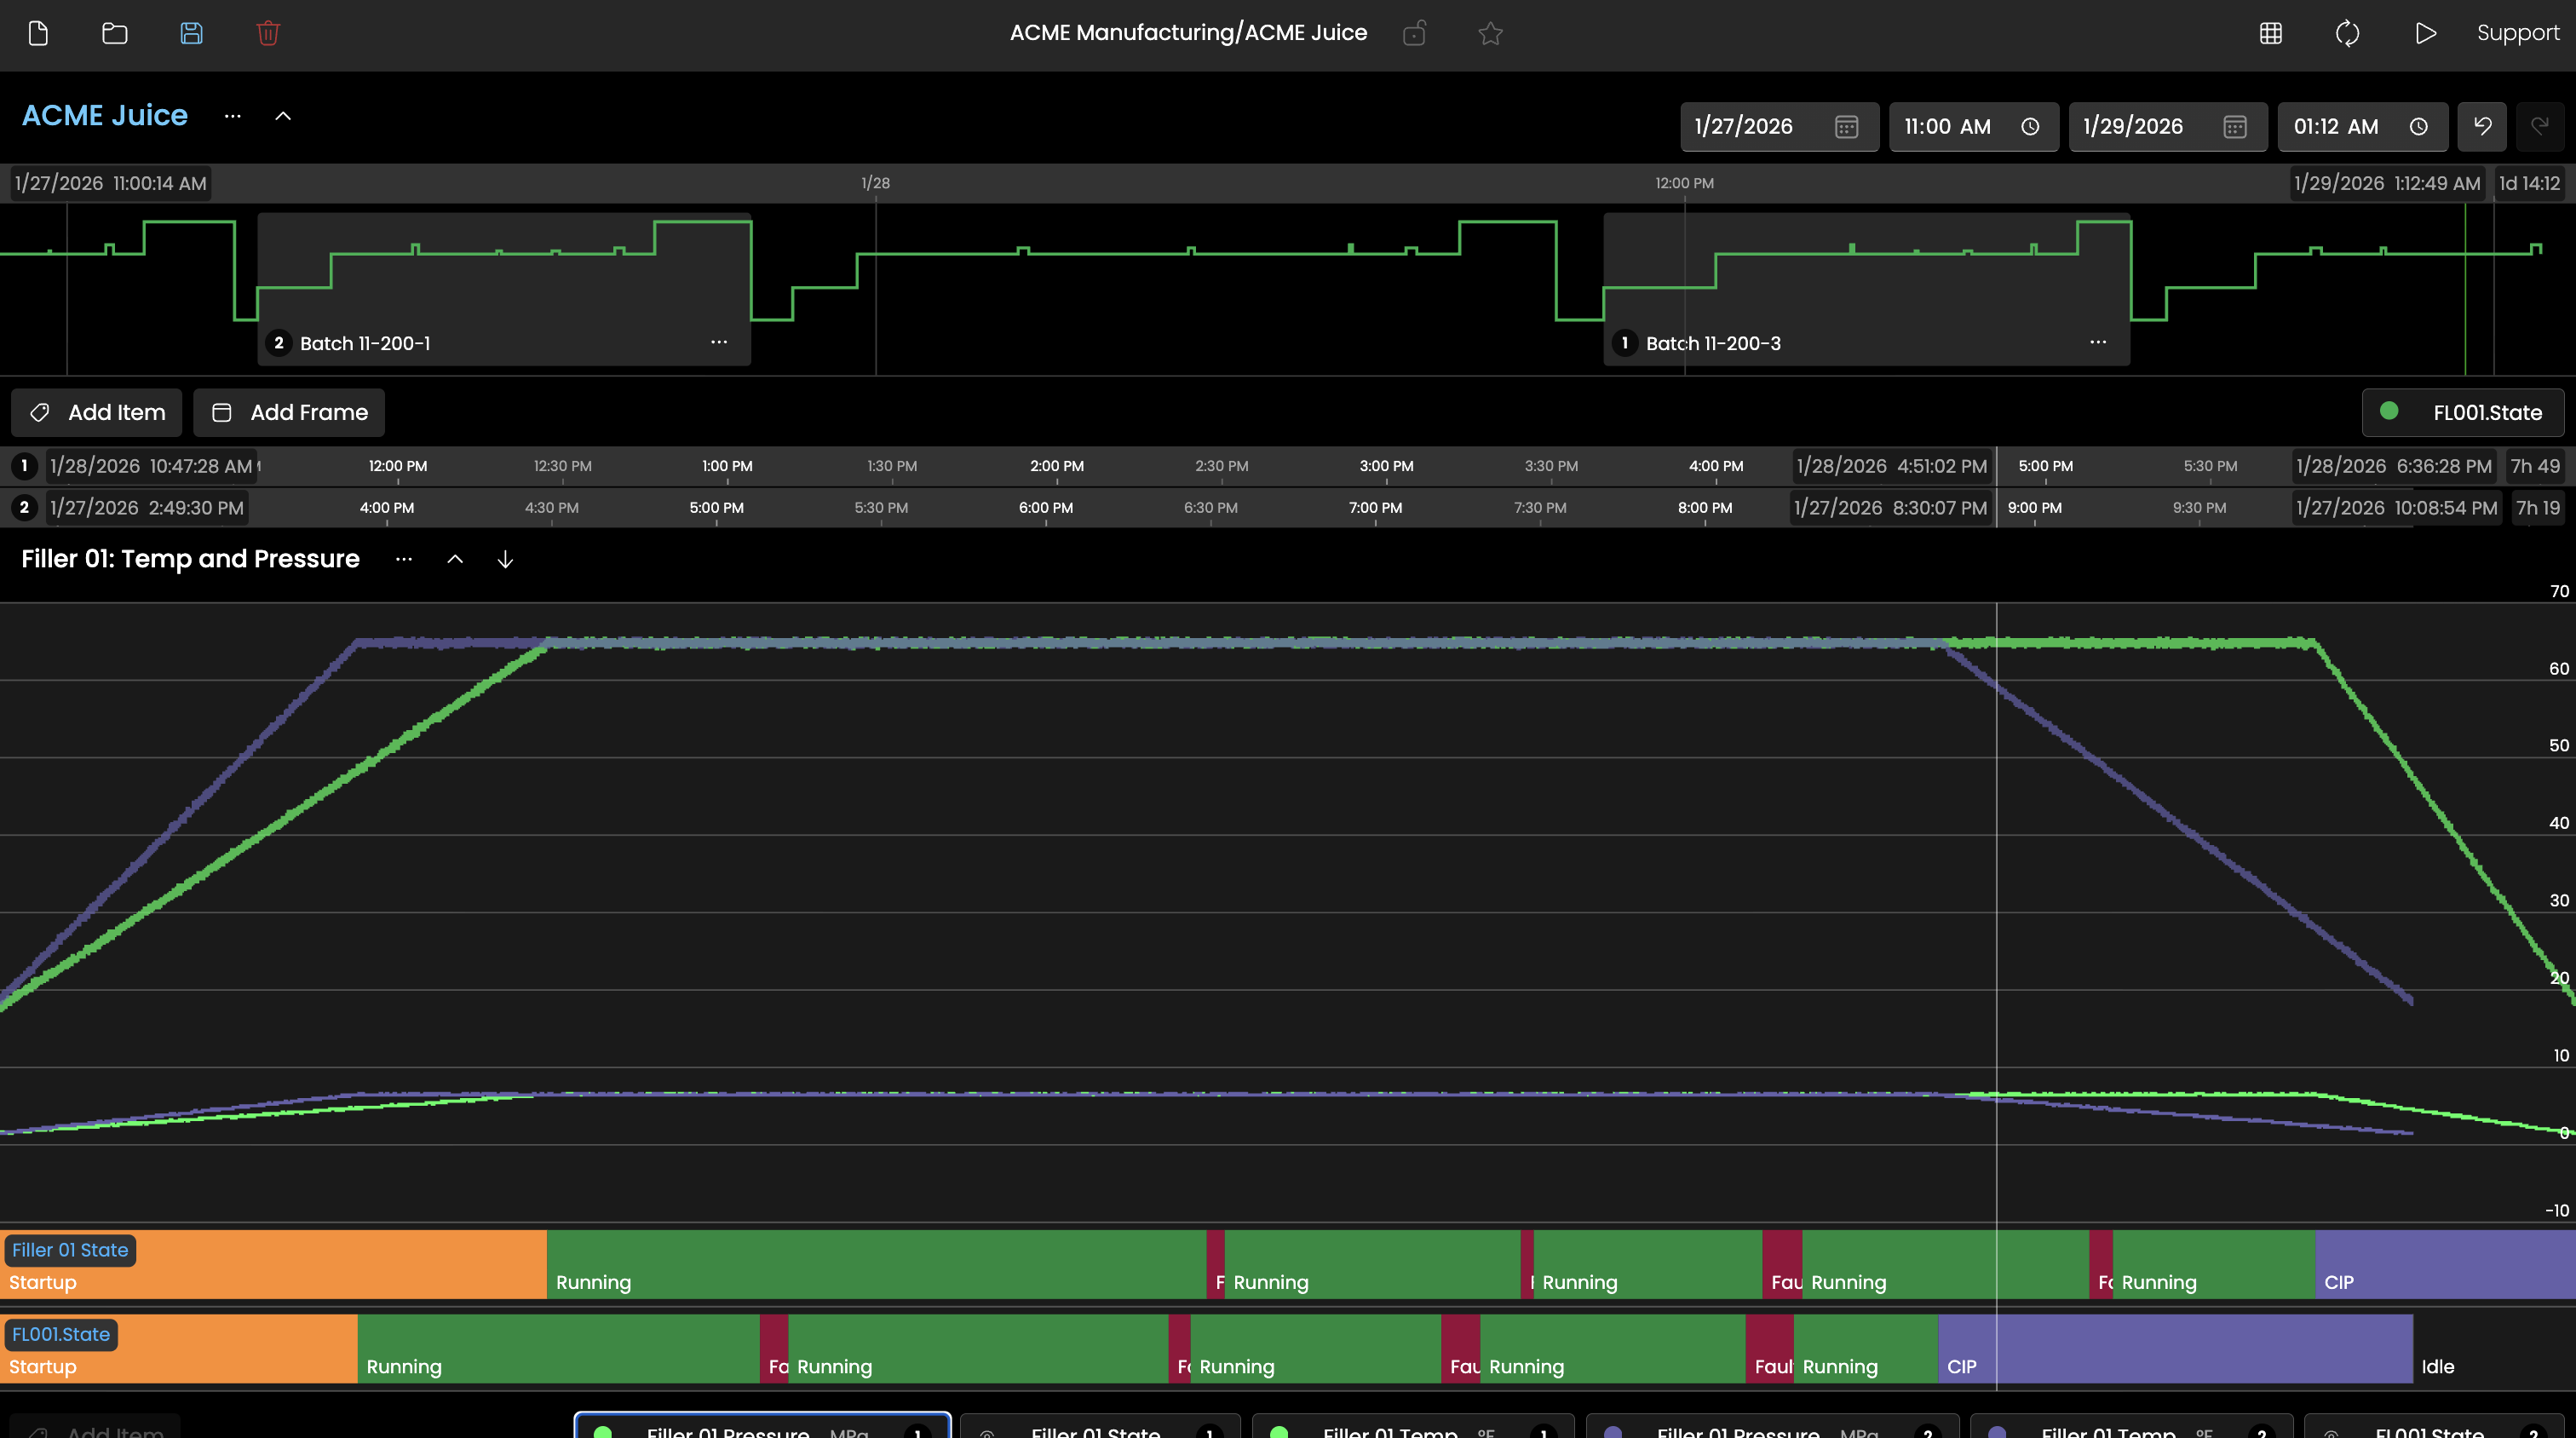
Explorer's Frame system lets users define up to three distinct time periods simultaneously and overlay them for direct comparison. Frames can be dragged, resized, and renamed, and when multiple Frames are active, all Trend Bands automatically left-edge align the start of each period so comparisons are visually immediate and require no manual adjustment. This makes it straightforward to compare this week's production run against last week's, or to isolate a normal operating window next to an anomalous one, without leaving the tool or exporting data.
Frames can be configured with relative time expressions (such as -1h for one hour ago or -1d for one day ago) rather than fixed timestamps. When Live Mode is enabled, relative Frames continuously advance with the clock, keeping the view anchored to the present. This means an operations team can build a standard view that always shows the current shift versus the prior shift, and that view stays current every time it is opened without any manual date adjustments.
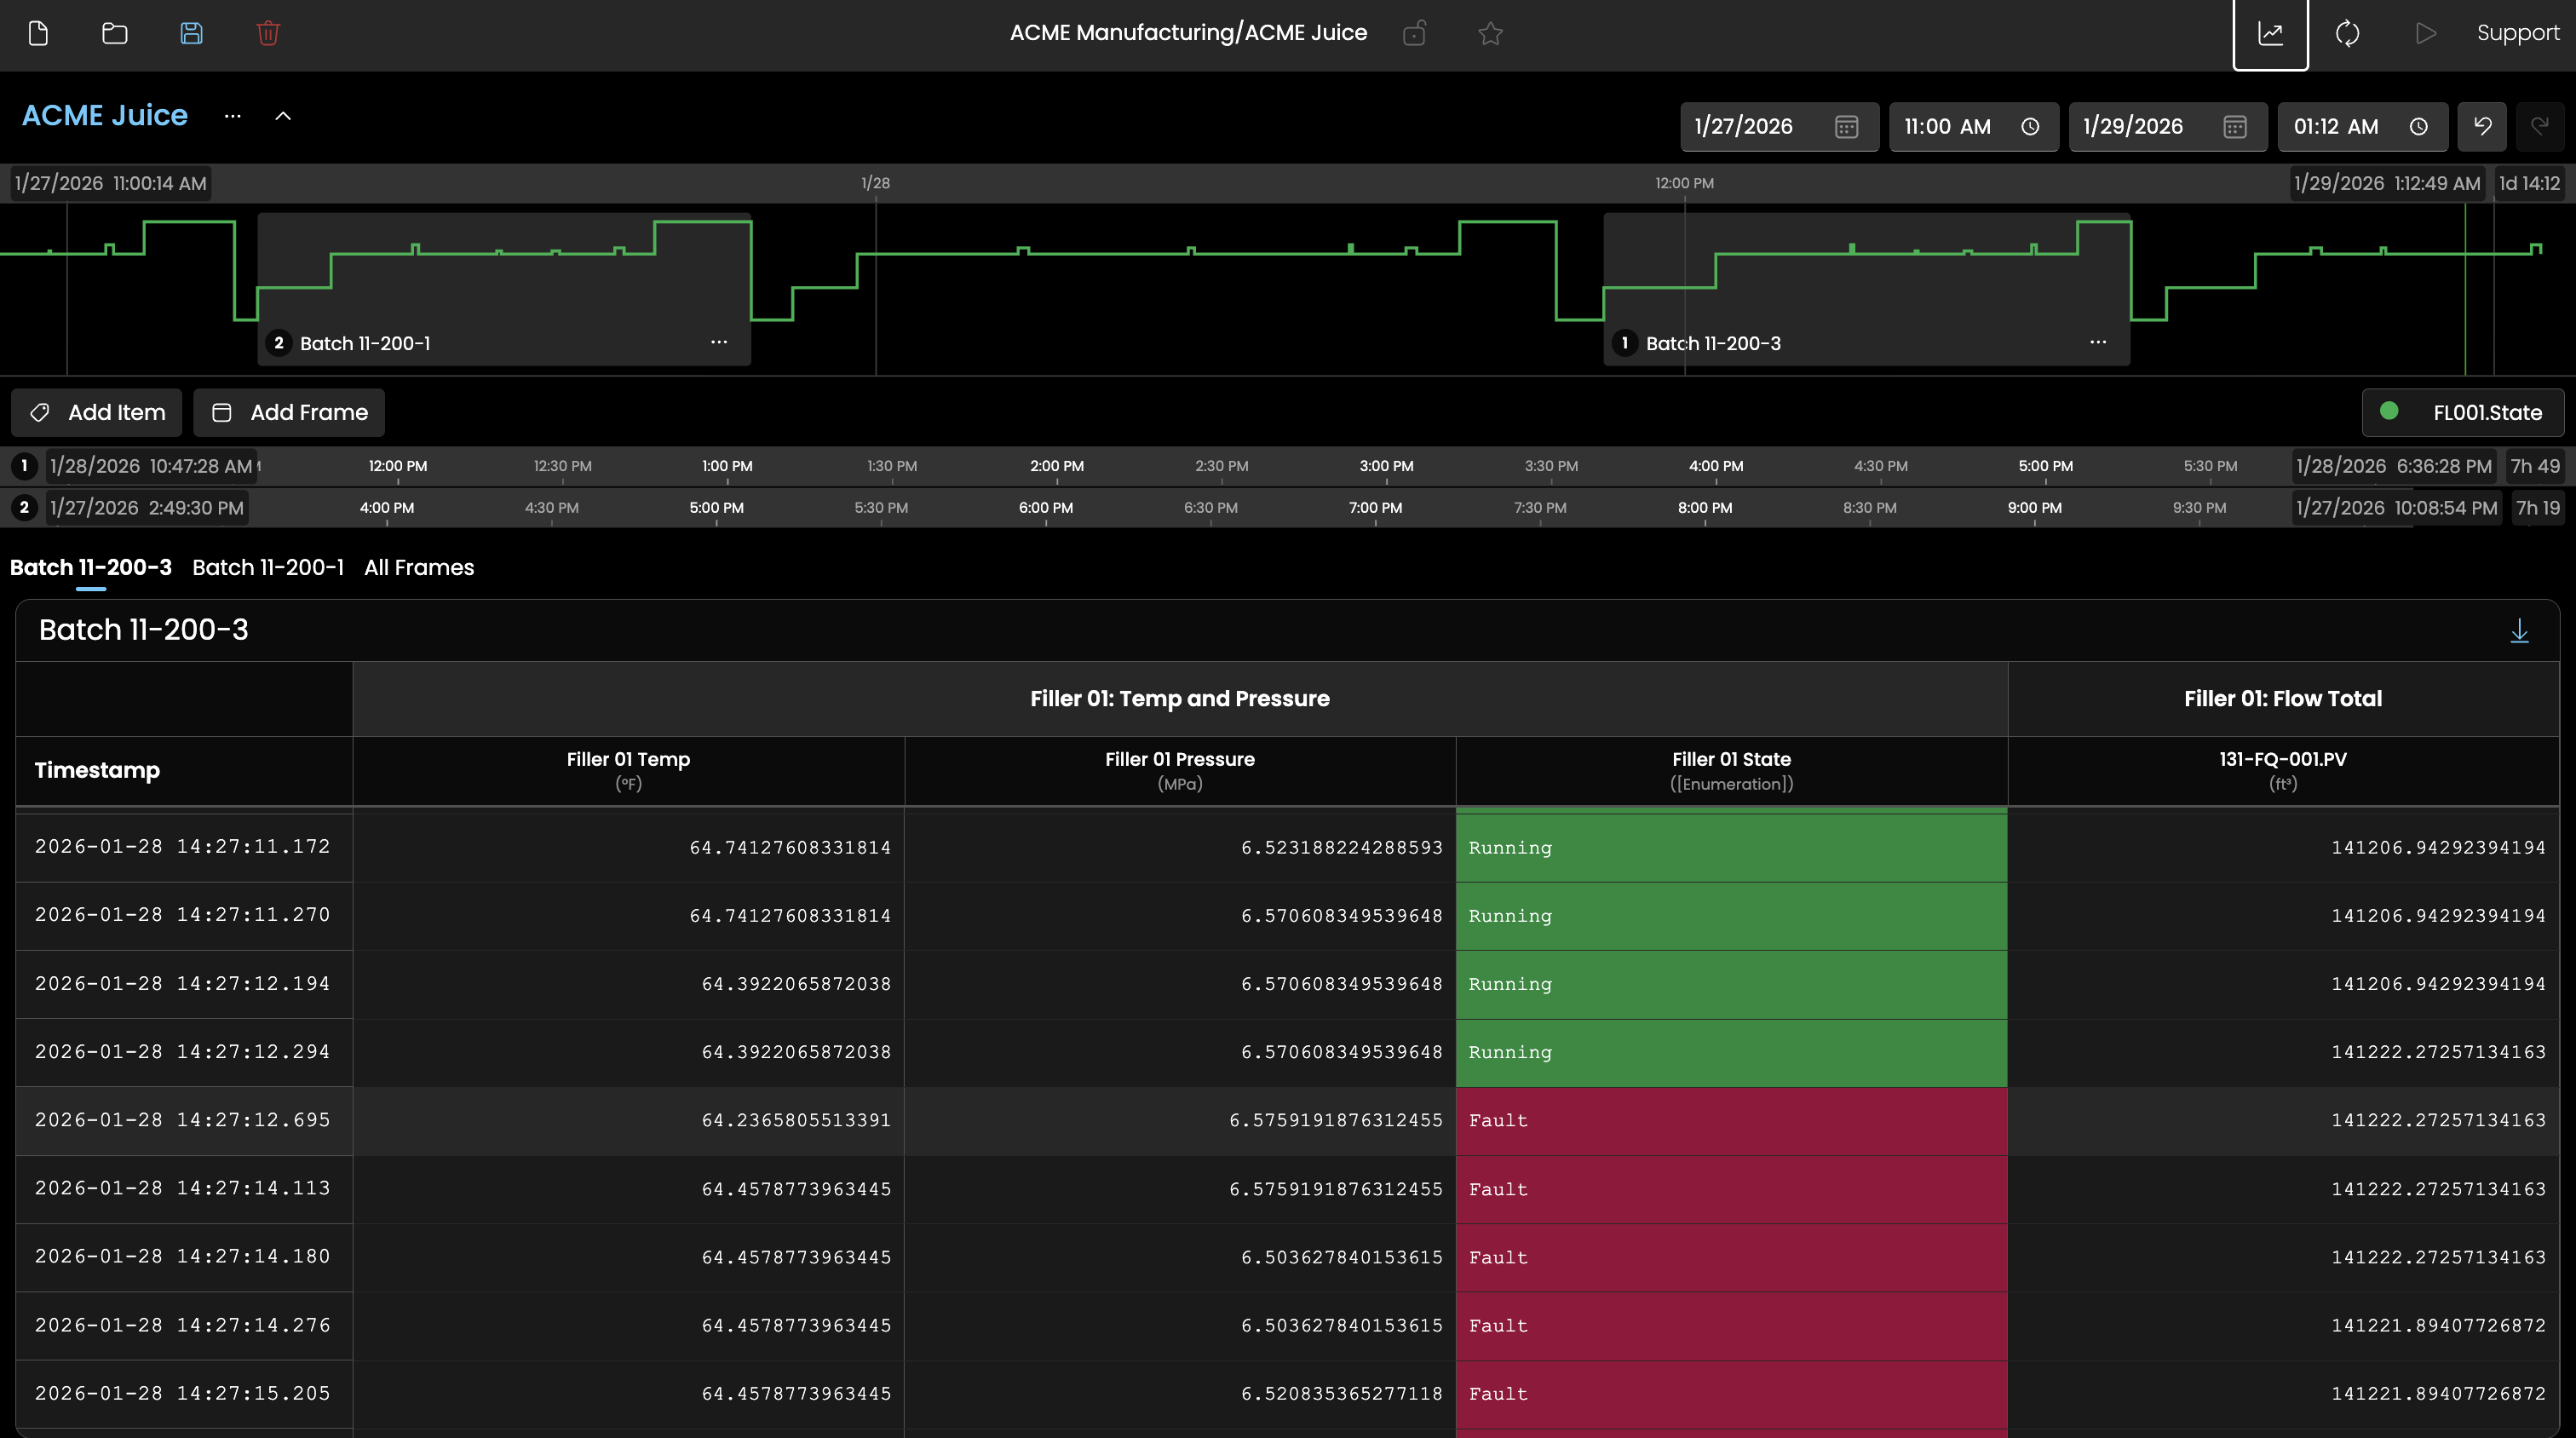
Explorer can switch from a visual chart to a structured data table that aggregates all plotted tags into a single wide format, normalized by timestamp. Where a tag has no value at a given timestamp, the prior value is carried forward to produce a complete, point-in-time accurate row. This view is well suited for sharing findings, feeding offline analytics tools, or validating data quality, and the entire result set can be exported as a CSV with a single click.
Explorer can switch from a visual chart to a structured data table that aggregates all plotted tags into a single wide format, normalized by timestamp. Where a tag has no value at a given timestamp, the prior value is carried forward to produce a complete, point-in-time accurate row. This view is well suited for sharing findings, feeding offline analytics tools, or validating data quality, and the entire result set can be exported as a CSV with a single click.
The Historian ensures your raw and original values are stored for as long as you desire. But what good is stored data if it's locked away behind a proprietary database with no access? No worries, Timebase makes it easy to use your data and make it work for you.
Query data as you need it using the well documented REST API. Search for tags. Assign metadata. Call for raw timestamp, value, and quality data points.
The commercially available MCP Server provides you the ability to plug in the LLM or AI agent of your choosing. Test it for free with the current beta release in version 1.2.
Need to subscribe to your data on change? Timebase Historian’s WebSocket connection delivers event-driven updates the moment values change. This enables DataOps pipelines to react immediately, triggering validations or downstream publishing without polling.
The i3X API (Industrial Information Interoperability eXchange) is an open, vendor-agnostic REST API specification designed to standardize how software applications access contextualized manufacturing data. Developed by CESMII, it aims to eliminate "API chaos" and vendor lock-in across industrial environments.
The team at Flow Software has a pair of AI Gateway solutions that couple MCP servers with the prebuilt tools you need to be successful right out of the box. Our team has worked hard to provide short context windows that make it possible for you to connect any MCP compliant agent to your data. Both Timebase and Flow Software's Infohub can be upgraded to include AI Gateway.