Hardware and Software Pre-Requisites
Download and Install Timebase Components
Launch the Timebase Services Starter
Configure and Run the Data Collector and Simulator Plugin
Verify Data Arrived in the Historian
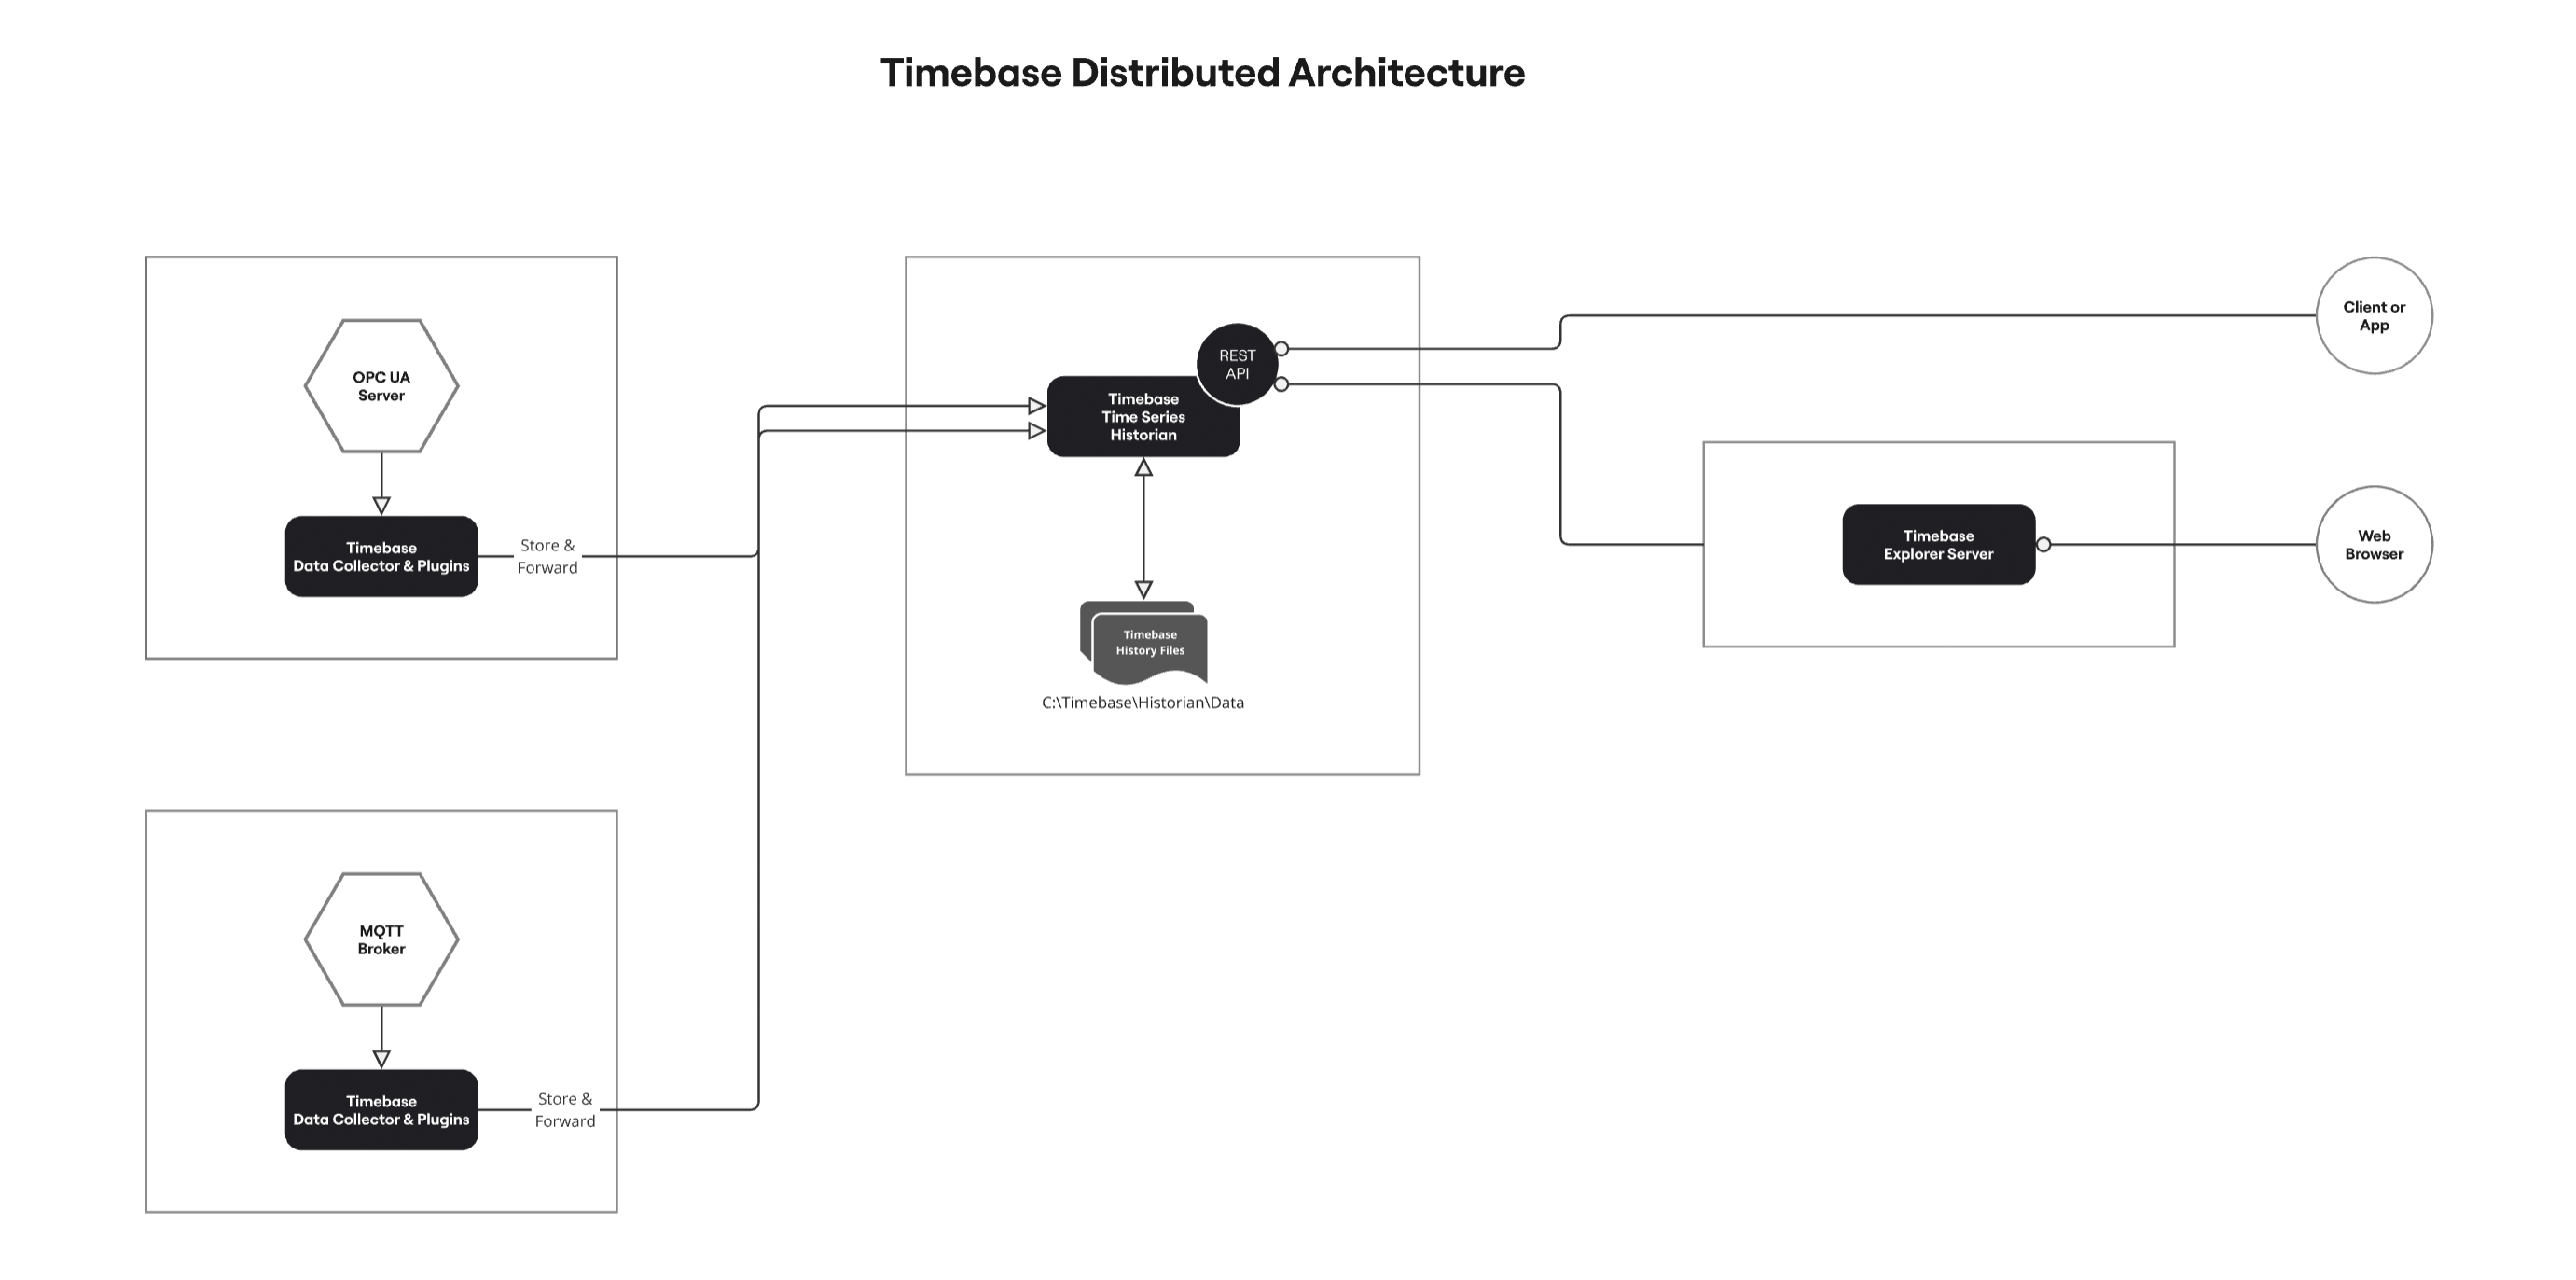
Select Your Architecture
A simple, or local, architecture means all components are installed on a single VM or machine and is typically only used for a quick proof of concept, testing environment, or perhaps on a small headless edge device.
Timebase provides 'Store and Forward' or (SF) natively. SF means that while logging data, should the historian become unavailable due to an event like a network outage or perhaps an IT security patch, the Data Collector will automatically buffer values to disk, greatly reducing your risk of data loss. If installed locally to the historian, you would not benefit from this feature.
A distributed architecture installs each component on a dedicated VM or machine, each with a specific function. For instance, since the Data Collector and Collector Plugins are used to connect to a data source such as an MQTT Broker or OPC UA Server you should ideally install these components local to the broker or server.
Hardware and Software Pre-Requisites
Reference this Timebase Knowledge Base article for a full list of recommended Hardware and Software Requirements.
A common item that will need installed is .Net 8 Core. Make sure you specifically install the .Net 8.0.x (ASP.NET Core Runtime - Hosting Bundle) - Download it here.

Download and Install Timebase
- Download the Windows Installer - Latest 1.2
- Run
'Timebase.msi'. - As you progress through the installer, we will automatically check for certain prerequisites, such as .Net 8 Core and require you to read and agree to the End User License Agreement before proceeding.
- Choose your desired configuration. You can install a single component of Timebase or all components using the same installer; simply ensure the components you desire are indicated with a check mark.
- Based on the components you are installing; choose the directory you wish to install Timebase to.
- We will default the application files to
C:\Program Files\Flow Software\Timebase and the Historical Data - We default historical data and log files to
C:\ProgramData\Flow Software\Timebase\Historian\Data.- To change this default follow these instructions after installation is complete.
- Timebase is built, maintained and supported by the team at Flow Software, hence the default installation folder structure.
- We will default the application files to
- After selecting your destination, you can finish the installation. The overall process should only take a few minutes.
Launch the Timebase Services Starter
Upon completion, the installer will automatically launch the Timebase Services Starter in the browser of your choosing. This can be found manually by navigating to localhost:4510 in a web browser.
Use the Services Starter config to start all services by clicking the Play icon for the Timebase Stack, located in the upper right hand corner of the table.

The video below provides an overview of the Services Starter config.
Configure and Run the Data Collector and Simulator Plugin
By default, the Collector initializes with the Simulator plugin. Click on the port number of the Simulator Collector (4521) to open the config for this Collector instance.
Use this article for a detailed walk-thru and video of the the Collector Config and how to start your Data Simulator logging session.
Use the following articles to switch your Data Source Type from Simulator to OPC UA, MQTT, or Sparkplug.
Verify Data Has Arrived in the Historian
Either navigate to the historian port, default location is localhost:4511 or, in a Windows environment, select the Historian port from the Services Starter config.
⚠️ Important: Windows anti-virus software must be restricted from scanning the directory containing the Timebase History Files. Failure to do so could result in a continuous loop of historian files being constantly scanned, validated, scanned, validated, and so on.
Edit Tag Properties
Browse your historian datasets and make changes to the tag configurations as necessary. You may select tags individually or select multiple tags using the Filter dialog box and the column of tick boxes on the left of the tag list.
Delete Individual Tags
Tags can be individually deleted by selecting each tag.
Delete an Entire Dataset
Although you can still delete the folders in Windows (be sure to stop the Collector first), the recommended method is to use our API. Please see our documentation Deleting Datasets via the API for more information.
⚠️ Important: The above steps permanently deletes the entire Dataset and all previously logged history. Be sure to take a backup and only follow these steps if you are certain you wish to permanently delete a Dataset and all of the tags, values, and properties held within.
Verify Your Data
Use Explorer Trending or the Time Series Historian API to access your datasets, tags and data being stored in the Historian
Secure Your System
If required, use Timebase Pulse to secure your Historian, Collectors, and Explorer.
Support Assistance
Struggling? We are here to help and will support you. Please log your ticket and we will respond via email.